Expectations shape behavior.
2015 was another year of top-quartile execution and performance.
Our basic thesis for consistently driving our share price higher is that, over time, asset quality, revenue growth and earnings growth are the most important valuation drivers. We continued to produce strong asset quality metrics in 2015, providing meaningful credit leverage for our firm.
We also continued our record for double-digit EPS growth in 2015, ending the year up 29.9 percent (excluding merger-related charges) over 2014 and exceeding the $2.40/share earnings budget we had set. In addition, our revenue growth rate was 31.6 percent year over year. Pinnacle also achieved outsized balance sheet growth, with total loans in the fourth quarter up 42.6 percent year over year and total core deposits up 44.6 percent year over year.
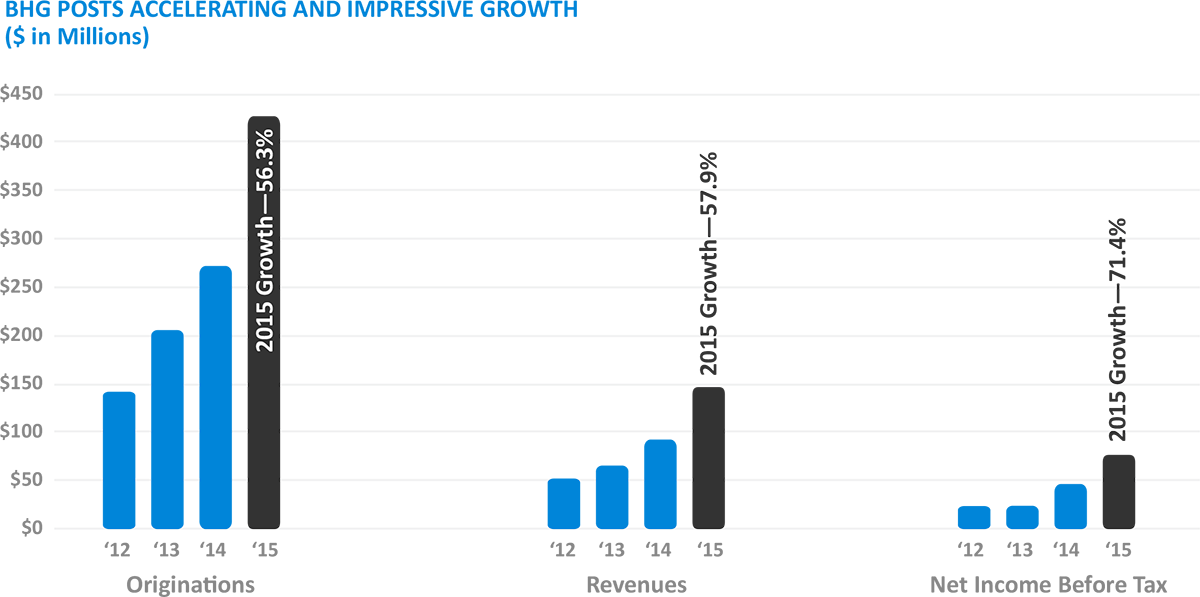
In 2015 we executed on several fee businesses intended to generate revenue for the firm. In February we acquired a 30 percent interest in Bankers Healthcare Group, which provides financing solutions to healthcare professionals throughout the United States. That investment exceeded our expectations, as BHG has seen significant growth in all key financial categories.
In addition, we have recruited a team of CRE lenders who are going after the most established developers and positioning Pinnacle as an extremely capable player in the space. They ended 2015 well ahead of schedule with nearly $200 million in net growth in outstanding balances. Our capital markets group, PNFP Capital Markets, Inc., has completed its broker/dealer registration and has started offering M&A advisory services and private placements of debt and equity to our middle-market clients.
Profitability
More than three years ago we laid out our sustainable business model, which at the time called for a targeted range of 1.10 to 1.30 percent for return on average assets. We also broke down targets for the four critical components required to produce that ROA—margin, noninterest income to assets, noninterest expense to assets and net charge-offs. Since then we increased our ROAA target range by 10 basis points.
We have achieved our target for return on average assets, ending 2015 at 1.24 percent, or 1.31 percent excluding merger-related charges, which is well within the range we established of 1.20 to 1.40 percent.
Also, for all of the critical components required to sustain that ROAA, we are operating within the published long-term target range. For quite some time the only component measure not performing in or better than the target range has been the noninterest expense to asset ratio. We have opted to improve that ratio by growing assets in the form of loans, and it’s working. Due to more clients coming to Pinnacle we are now in the target range.
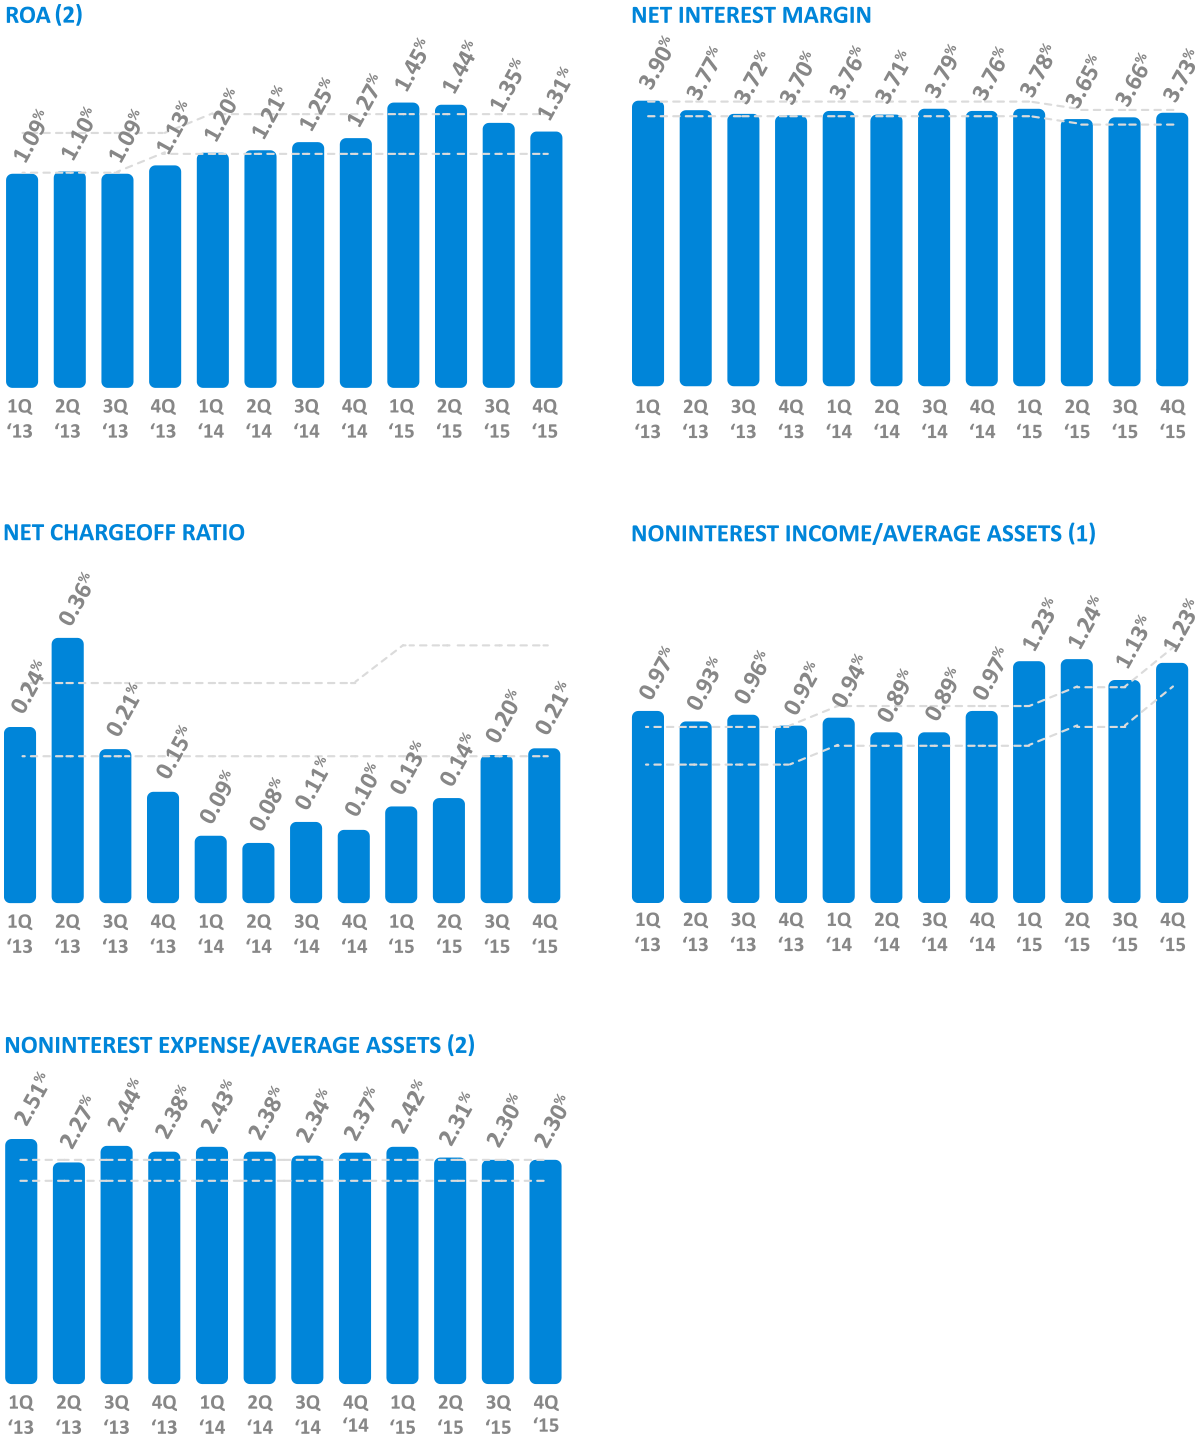
- Calculation excludes net gains and losses on the sale of investment securities and in the second quarter of 2013 noncredit related loan losses
- Calculation excludes OREO expense and FHLB prepayment charges. Noninterest expense for 2Q13 includes the impact of the reversal of a $2.0 million allowance for off-balance sheet commitments

M. Terry Turner, President and CEO introduces the 2015 Online Annual Report